
*Disclaimer* This blog was inefficiently written by a human (me) and not AI. Any errors, issues or other human-slop is proudly my own
As anyone who has seen some of my older posts knows, I’ve got a thing for a good ‘ol semantic layer. I cut my analytics teeth on SQL Server Analysis Services (MDX, not tabular!) and Business Objects back in the day, and I’ve always found them an excellent way of presenting a business-friendly way of presenting key definitions and metrics back to be consumed with downstream serving tools.
Stepping forward to today, we now have Metric Views in Databricks (huzzah!). This post isn’t an in-depth look at what Metric Views are – you can read our blogs and docs for that, but this will provide a quickstart in creating your first Metric View with Databricks, along with some example advanced use cases to show you how to extend them further.
What Are Metric Views?
Straight from the docs, Metric Views are:
Metric views abstract complex business logic into a centralised definition, enabling organisations to define key performance indicators once and use them consistently across reporting tools like dashboards, Genie spaces, and alerts. Metric views are defined in YAML format and registered in Unity Catalog. You can create them using SQL or the Catalog Explorer UI. Like any other table or view, metric views can be queried using SQL.
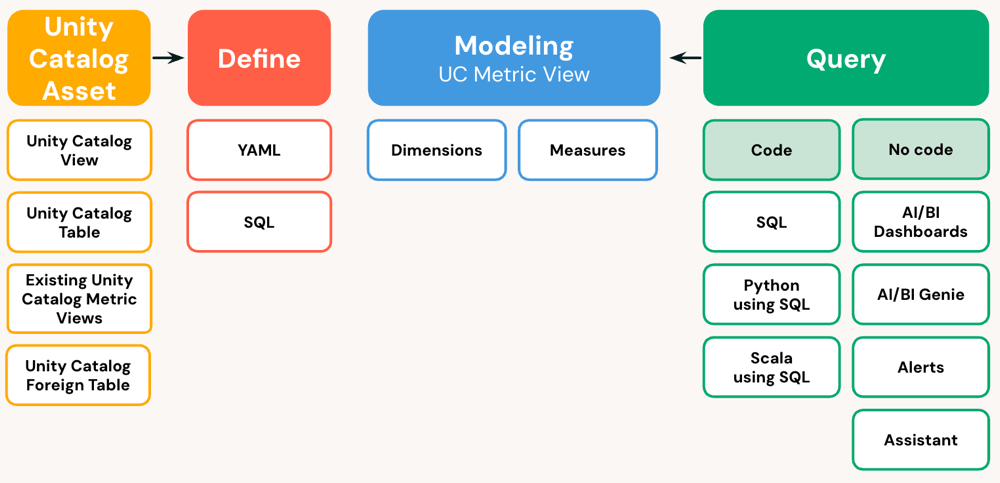
In terms of benefits, they provide the following:
- Standard Metric Definitions across teams and tools
- Handle Complex Measures such as ratios and other semi-additive constructs
- Enable flexible analysis by supporting both star and snowflake schemes with nested joins
- Accelerate query performance with built-in materialisation options
- Much simplified user experience while honouring governance
Getting Started
As always, and call it a habit, but I’ll be using AdventureWorks for this demo. It’s simple to use and has enough content to demonstrate its usefulness with good examples.
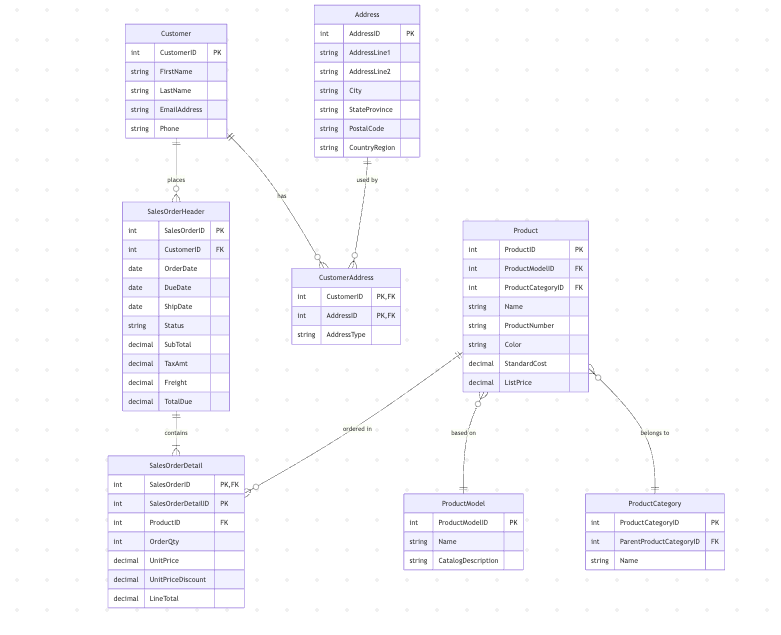
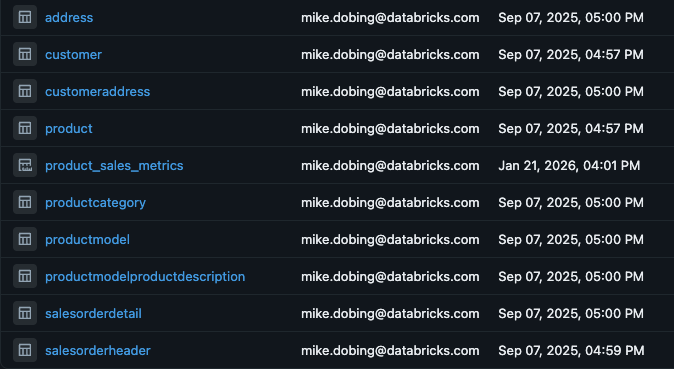
And here are my nice simple tables in Unity Catalog, ready for some Metric View goodness:
Now, these tables on their own answer a lot of base questions we could get, such as “Show me how many sales we made of Bikes”, or “What’s the top-selling model of Helmets”, that kind of thing.
These can be answered simply with basic SQL, which won’t shock anyone:
SELECT PC.Name, SUM(S.LineTotal) AS TotalFROM productcategory PC INNER JOIN mido_edw_dev.adventureworks.product p ON PC.ProductCategoryID = p.ProductCategoryIDINNER JOIN mido_edw_dev.adventureworks.salesorderdetail s ON p.ProductID = s.ProductIDGROUP BY PC.NameBut what if we need to query and group by, say, ProductModel? We can write a new query, grouped by that, but it’s a different granularity than ProductCategory. So you end up with a different query. Then you add ratio-type measures or percents and other semi additive measures over time, which can’t be pre-calculated at all(well, you can, but the result is static, not additive), since it all depends on the query’s context and needs to be calculated at run time. This means you end up adding calculated measures directly to reports, with the logic having to be repeated in any other consuming tool. This in turn leads to potential metric chaos as definitions get lost, modified, changed, etc. throughout the organisation, leading to the classic “multiple versions of the truth.”
You get the idea.
A Metrc View eliminates this by enabling a “write once, use many” approach. Definte a measure once, and it can be used in DBSQL, AIBI Dashboards and Genie without business users having to worry about different grains or semi-additive measures or how complex the SQL for “MOM__AVG_DEBT_DAYS_ARR” really is. They just consume and use.
Simples.
Our First Metric View
With the ‘why’ out of the way, let’s show some examples.
We can create our first metric view in a few different ways, but this wouldn’t be SQLoftheNorth if we didn’t use SQL, so here’s our first one (run this in SQL Editor or a notebook cell).
Note the use of the nested joins to reflect the snowflake joins (salesorderdetail -> product -> productcategory) in the join and the naming convention used to reflect columns from tables in the joining hierarchy:
use mido_edw_dev.adventureworks;CREATE OR REPLACE VIEW mido_edw_dev.adventureworks.product_sales_metricsWITH METRICSLANGUAGE YAMLAS $$ version: 1.1 source: mido_edw_dev.adventureworks.salesorderdetail comment: Product sales metrics by category for revenue analysis joins: - name: product source: mido_edw_dev.adventureworks.product using: - ProductID joins: - name: productcategory source: mido_edw_dev.adventureworks.productcategory on: product.ProductCategoryID = productcategory.ProductCategoryID dimensions: - name: Category Name expr: product.productcategory.Name display_name: Product Category comment: Name of the product category synonyms: - category - product category measures: - name: Total Sales expr: SUM(source.LineTotal) display_name: Total Sales comment: Sum of all line totals for products format: type: currency currency_code: USD decimal_places: type: exact places: 2 synonyms: - revenue - sales - total revenue$$;-- Query the metric viewSELECT `Category Name`, MEASURE(`Total Sales`) AS TotalFROM mido_edw_dev.adventureworks.product_sales_metricsGROUP BY ALLORDER BY Total DESC;Nested Joins and Naming Conventions
Before we proceed, I want to call out something that sometimes gets missed when defining the metric view in SQL. Note the indentation of the joins when doing snowflake joins, and also the naming convention used to reference dimensions from the joined columns. It’s in the docs, but isn’t immediately obvious:
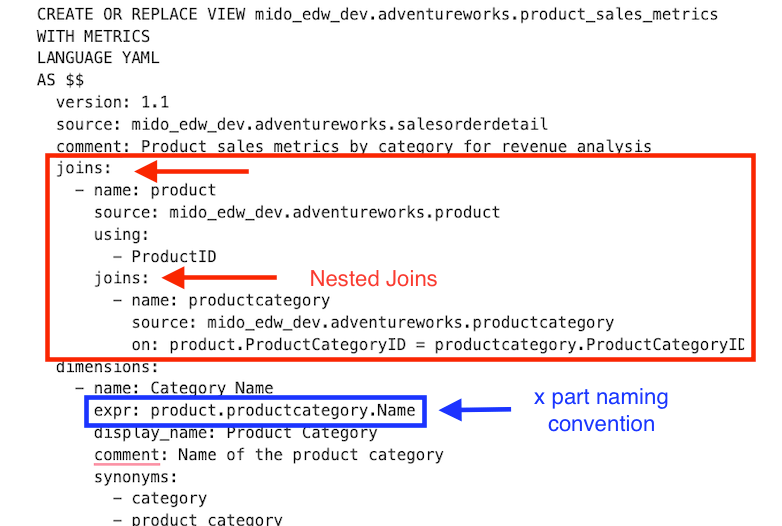
If you get these wrong, you may get errors relating to a “column X not found, did you mean…?” So keep an eye out for this if you get any issues.

Querying a Metric View
With our basic metric view created, we can now query it with DBSQL, AIBI Dashboards and Genie:
SQL Editor
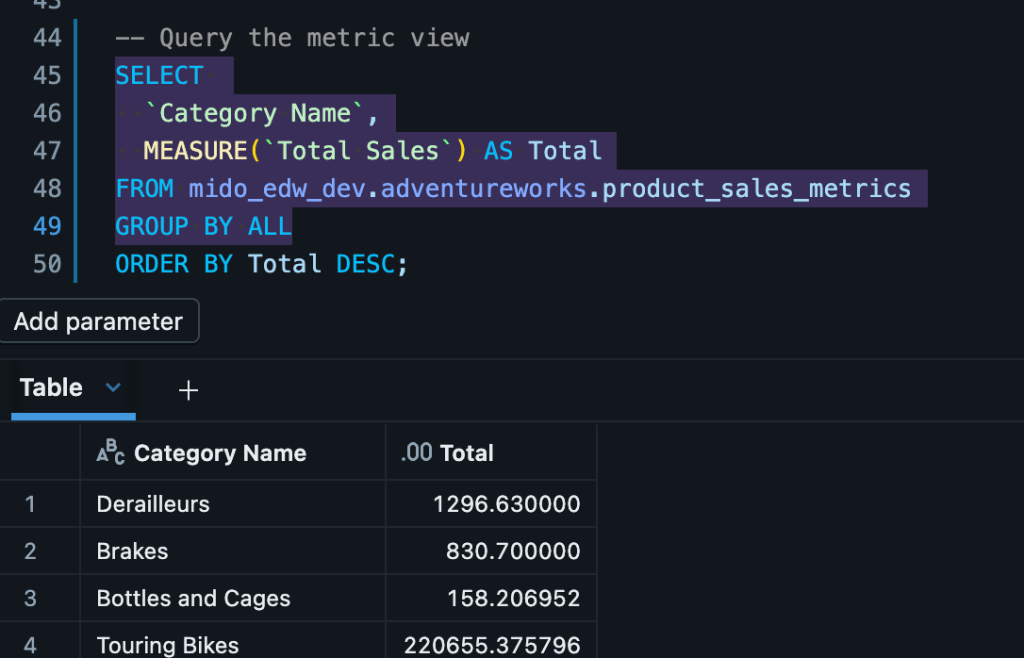
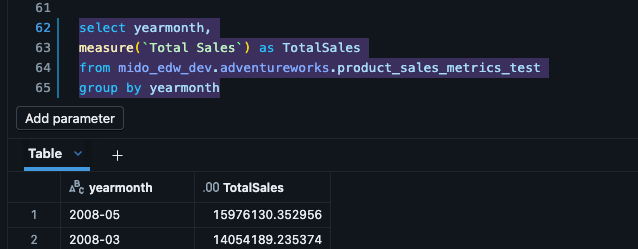
The first, most obvious way to test your metric view is to query it directly. Note the use of the MEASURE function to query our measures. Regardless of any underlying complexity in the measure or any conditional code in the dimensions, this is pretty much as complex as a SQL query gets with Metric Views:
Dashboard
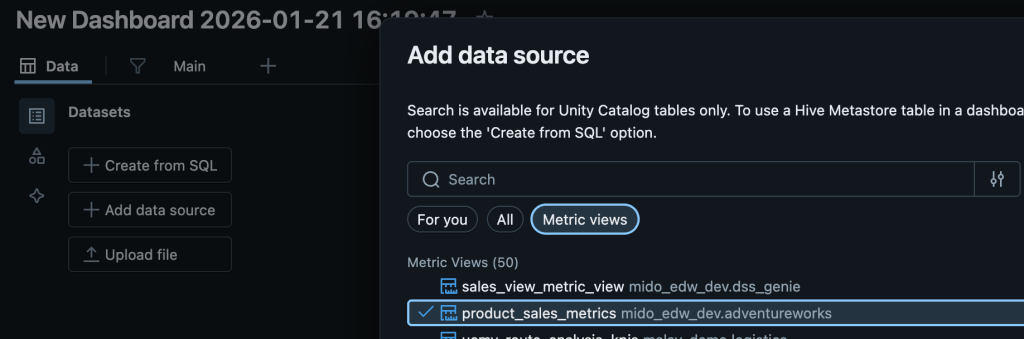
Using metric views in AIBI Dashboards is also super simple, we simply add our source metric view as a data source:
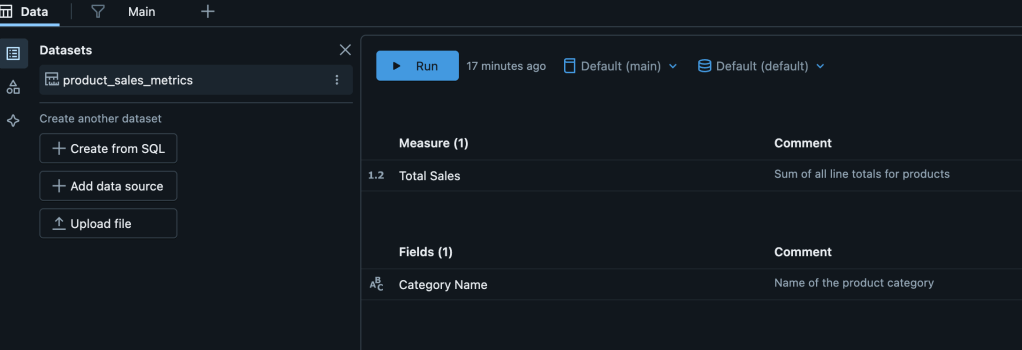
And we can see our (very simple) metric view with one dimension and measure:
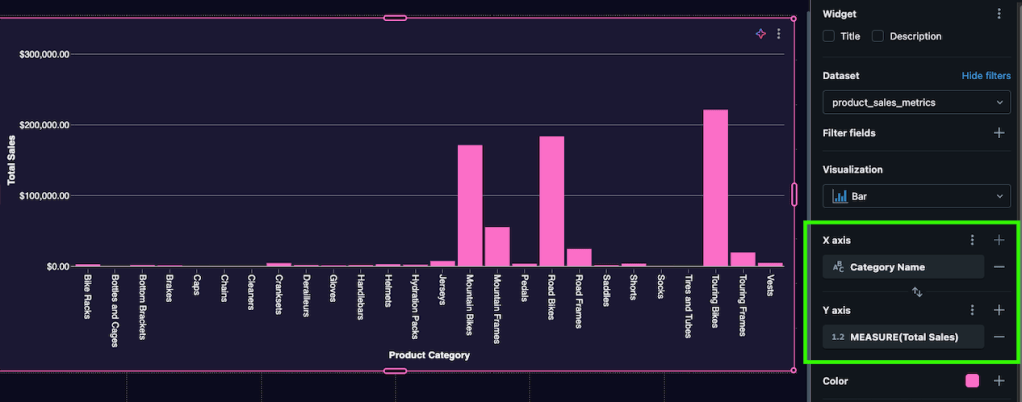
And create our visuals like any other:
And finally, with Genie:
Genie
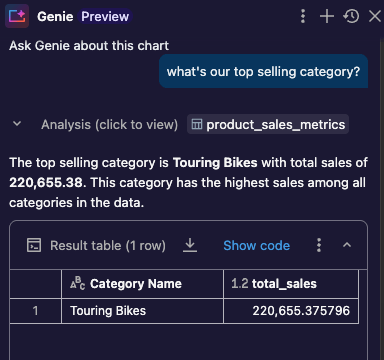
As you can see from the above, all the tools, be it Databricks SQL, Genie or Dashboards can understand and talk to the metric view, removing any need for a user to define measures and dimensions or understand joins or other business rules. It just works.
But the above is a simple version. Below, I’ll extend the Metric View to show some more advanced uses, such as handling non-additive measures, adding structs, linking to other Metric Views and more.
Metric Views – Beyond the 101
Now we’ve got our base metric view. The next step is to add a couple of new requirements:
- I need to create specific metrics for categories, to allow us to analyse them by individually.
- I need to view view a cumulative cost of product sales over time, by month and year.
- I need to add multiple items from the Product Model, but they aren’t always needed
Let’s break these artificially created requirements down to show how we can extend our view to handle them.
Create New Measure Definitions
In the first requirement, we want to be able to use measures for specific categories, rather than having to use the Category Name in the visual. Specifically, “accessory sales”, “bike sales” etc.
This one is relatively simple, and we can add a CASE statement to our view for our new measures:
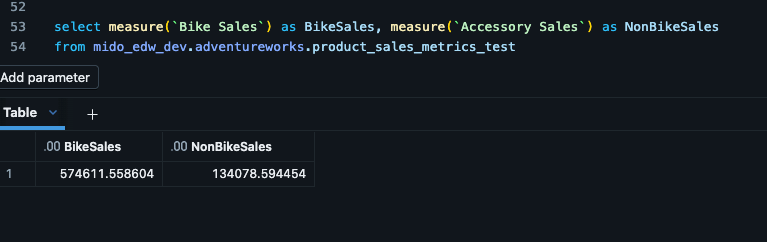
measures: - name: Total Sales expr: SUM(source.LineTotal) display_name: Total Sales comment: Sum of all line totals for products format: type: currency currency_code: USD decimal_places: type: exact places: 2 - name: Bike Sales expr: SUM(CASE WHEN product.ProductCategoryID in (1,5,6,7) THEN source.LineTotal ELSE 0 END) display_name: Bike Sales comment: Sum of all line totals for products in the Bike categories synonyms: - bike revenue - bike total revenue - name: Accessory Sales expr: SUM(CASE WHEN product.ProductCategoryID not in (1,5,6,7) THEN source.LineTotal ELSE 0 END) display_name: Accessory Sales comment: Sum of all line totals for products in the non Bike categories synonyms: - Accessory revenue - Accessory total revenueAnd we can query those measures as normal:
Requirement 2: Window Functions/Time Intelligence
In this example, we need to add rolling-window-type calculations to our metric view. Typically, these can be things such as looking at Month on Month calculations, or “This Time Last Year”, or other kinds of things that normally require CTEs and predefined queries to handle them.
In a metric view, however, we need to save the user from such complexity and add it to the view itself.
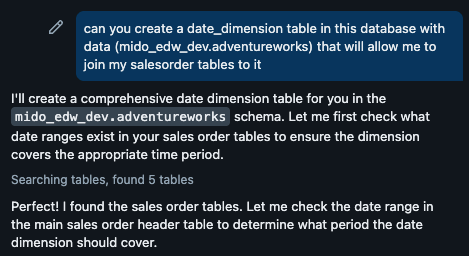
So, for this example, I first need to inject some date dimension type data that we don’t have currently.
*shameless Databricks plug alert*
I don’t have a date time dimension, I leveraged the new-ish agent functionality to generate one for me:
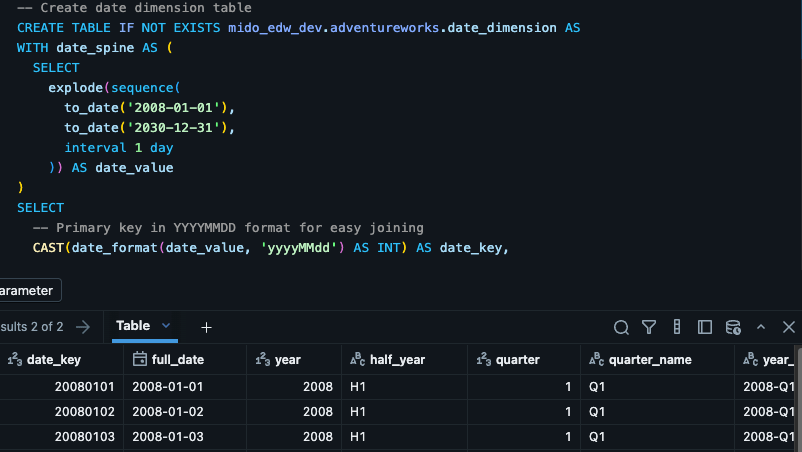
And voila, we have our new Date Dimension:
We’ll modify the metric view to add our data dimension first, in the same way we did previously:
CREATE OR REPLACE VIEW mido_edw_dev.adventureworks.product_sales_metrics_testWITH METRICSLANGUAGE YAMLAS $$ version: 1.1 source: mido_edw_dev.adventureworks.salesorderdetail comment: Product sales metrics by category for revenue analysis joins: - name: product source: mido_edw_dev.adventureworks.product using: - ProductID joins: - name: productcategory source: mido_edw_dev.adventureworks.productcategory on: product.ProductCategoryID = productcategory.ProductCategoryID - name: salesorderheader source: mido_edw_dev.adventureworks.salesorderheader on: source.SalesOrderID = salesorderheader.SalesOrderID joins: - name: date_dimension source: mido_edw_dev.adventureworks.date_dimension on: CAST(date_format(salesorderheader.OrderDate, 'yyyyMMdd') AS INT) = date_dimension.date_key dimensions: - name: Category Name expr: product.productcategory.Name display_name: Product Category comment: Name of the product category synonyms: - category - product category - name: YearMonth expr: salesorderheader.date_dimension.year_month measures: - name: Total Sales expr: SUM(source.LineTotal) display_name: Total Sales comment: Sum of all line totals for products format: type: currency currency_code: USD decimal_places: type: exact places: 2 - name: Bike Sales expr: SUM(CASE WHEN product.ProductCategoryID in (1,5,6,7) THEN source.LineTotal ELSE 0 END) display_name: Bike Sales comment: Sum of all line totals for products in the Bike categories synonyms: - bike revenue - bike total revenue - name: Accessory Sales expr: SUM(CASE WHEN product.ProductCategoryID not in (1,5,6,7) THEN source.LineTotal ELSE 0 END) display_name: Accessory Sales comment: Sum of all line totals for products in the non Bike categories synonyms: - Accessory revenue - Accessory total revenue$$;And we can query using our new dimension:
Adding Time Intelligence
And to extend this further, we’ll add a time intelligence function to show we can use our more complex metric. Specifically, cumulative sales. (You can see a full range of options here)
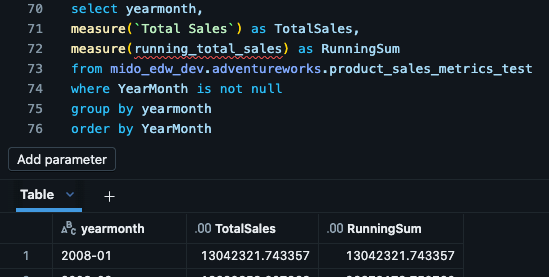
We make a final addition to our metric view, adding our new cumulative sum measure. Note how we reference the previous measure (‘total sales’) so we don’t need to redefine every time:
    - name: running_total_sales
      expr: (`Total Sales`)
      window:
        - order: YearMonth
          range: cumulative
          semiadditive: last
And we can query this alongside our regular metric to show the impact:
Hopefully this shows a simple example of how we can use advance metrics and time intelligence to augment and expand our base metrics for more complex use cases.
Requirement 3: Adding Multiple Dimension Columns from a Dimension Table
In this example, let’s say the users want to use N number of columns from a table, such as ProductModel, but it’s not always the same ones. Sure, you can define each dimension individually for those often used (as is correct) but what about lesser used columns? Well, have no fear, you can leveraged a STRUCT to expose the dimension table and query the columns you need at run time.
We extend our Metric View a further time, adding the ProductModel as a struct:
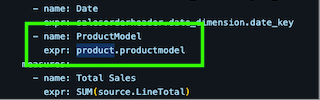
Note we don’t add a column name to the expr, this time it’s just the table reference.
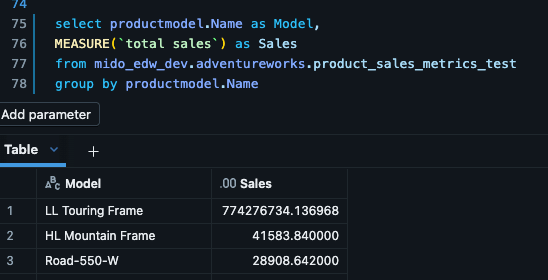
Then, in the query, we can reference any column we need by referencing it in the struct:
Summary
Hopefully this blog shows you the basics of contructing your first metric in Databricks and how to use it, and highlighted how you can extend them with some examples of more complex use cases.
As always, drop me a comment if you’ve got any thoughts, queries, challenges.
